サーバー負荷監視用ウィジェットを表示する方法
この記事では、サーバー負荷監視ウィジェットを設置する方法を紹介します。
ダッシュボードに表示されて、ショートコードも使えますので、クラシックエディタに貼るだけで、CPU使用率とサーバー全体のメモリ使用量をリアルタイムで表示できます。
1 functions.php にコードを追加
以下のコードを子テーマの functions.php に追加します。
//------------------------------------------------------------
// 投稿ページ限定|サーバー負荷監視ウィジェット
//------------------------------------------------------------
add_action('wp_head', function() {
if ( is_single() && !is_page() && !is_category() && !is_archive() ) {
echo '<link rel="manifest" href="/manifest.json">';
}
});
add_action('wp_enqueue_scripts', function() {
if ( is_single() && !is_page() && !is_category() && !is_archive() ) {
wp_enqueue_script('pwa-register', get_stylesheet_directory_uri() . '/js/pwa-register.js', [], null, true);
wp_enqueue_script('pwa-body', get_stylesheet_directory_uri() . '/js/pwa-body.js', [], null, true);
}
});
add_filter('body_class', function($classes) {
if (is_single()) {
$classes[] = 'pwa-active';
}
return $classes;
});
// Ajaxハンドラー:CPU使用率とサーバー全体メモリ
add_action('wp_ajax_get_server_stats', 'get_server_stats');
add_action('wp_ajax_nopriv_get_server_stats', 'get_server_stats');
function get_server_stats() {
$stat1 = file_get_contents('/proc/stat');
usleep(500000);
$stat2 = file_get_contents('/proc/stat');
$cpu_usage = 0;
if ($stat1 && $stat2) {
$lines1 = explode("\n", $stat1);
$lines2 = explode("\n", $stat2);
$cpu1 = preg_split('/\s+/', $lines1[0]);
$cpu2 = preg_split('/\s+/', $lines2[0]);
$total1 = array_sum(array_slice($cpu1, 1));
$total2 = array_sum(array_slice($cpu2, 1));
$idle1 = $cpu1[4];
$idle2 = $cpu2[4];
$total_diff = $total2 - $total1;
$idle_diff = $idle2 - $idle1;
if ($total_diff > 0) {
$cpu_usage = round((1 - $idle_diff / $total_diff) * 100, 2);
}
}
$meminfo = file_get_contents('/proc/meminfo');
preg_match('/MemTotal:\s+(\d+) kB/', $meminfo, $matches_total);
preg_match('/MemAvailable:\s+(\d+) kB/', $meminfo, $matches_avail);
$total_mem = isset($matches_total[1]) ? $matches_total[1] / 1024 : 0;
$avail_mem = isset($matches_avail[1]) ? $matches_avail[1] / 1024 : 0;
$used_mem = $total_mem - $avail_mem;
wp_send_json([
'cpu' => $cpu_usage,
'memory' => round($used_mem, 2) . ' / ' . round($total_mem, 2) . ' MB'
]);
}
function server_stats_shortcode() {
$ajax_url = esc_url( admin_url('admin-ajax.php') . '?action=get_server_stats' );
ob_start();
?>
<div id="server-stats-widget">
<span id="cpu-load">CPU: -- %</span><br>
<span id="memory-usage">メモリ: -- / -- MB</span>
</div>
<script>
(function(){
const ajaxUrl = "<?php echo $ajax_url; ?>";
function updateStats() {
fetch(ajaxUrl)
.then(res => res.json())
.then(data => {
document.getElementById('cpu-load').textContent = "CPU: " + data.cpu + " %";
document.getElementById('memory-usage').textContent = "メモリ: " + data.memory;
})
.catch(e => console.error("Server Stats Error:", e));
}
updateStats();
setInterval(updateStats, 5000);
})();
</script>
<?php
return ob_get_clean();
}
add_shortcode('server_stats', 'server_stats_shortcode');
//管理画面で表示
add_action('wp_dashboard_setup', function() {
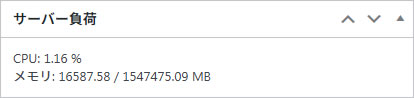
wp_add_dashboard_widget('server_load_dashboard', 'サーバー負荷', function() {
echo server_stats_shortcode(); // ショートコード関数を直接呼ぶ
});
});
補足:
- 管理画面のダッシュボードは自動で表示されます。
- クラシックエディタで以下のショートコードを貼るだけで、ウィジェットが表示されます。
- 管理画面のダッシュボードは自動で表示されます。
- クラシックエディタで以下のショートコードを貼るだけで、ウィジェットが表示されます。
ウィジェット、記事内で表示する場合:
[server_stats]
2 動作のポイント
- CPU使用率とメモリ使用量は Ajax で5秒ごとに更新されます。
- ダッシュボードに表示されます。
- ショートコード
[server_stats]は必要に応じて複数ページで使用できます。
3 完成イメージ
3.1 管理画面のダッシュボードで表示
3.2 ショートコードで表示
クラシックエディタで以下のショートコードを貼るだけで、ウィジェットが表示されます。
CPU: -- %
メモリ: -- / -- MB
メモリ: -- / -- MB
4 代用プラグイン
もしコード実装が難しい場合や、より高度な監視・通知機能を求める場合は、以下のプラグインを利用するのもおすすめです。
| プラグイン名 | 主な特徴 |
|---|---|
| WP Server Stats | WordPress管理画面にCPU、メモリ、ディスク使用率をリアルタイム表示。グラフ形式でわかりやすい。 |
| Query Monitor | サーバー負荷に加え、PHPエラー・DBクエリ・フックの実行時間なども可視化できる高機能ツール。 |
| Health Check & Troubleshooting | サーバー環境やPHP設定、プラグインの動作状態などを包括的に診断。軽量で安全。 |
補足:
- コード方式は軽量で高速ですが、詳細なログや履歴は残りません。
- 高度な監視や警告通知が必要な場合は「WP Server Stats」または「Query Monitor」を推奨します。
- 投稿ページのみの限定動作で安全に導入できます。
- コード方式は軽量で高速ですが、詳細なログや履歴は残りません。
- 高度な監視や警告通知が必要な場合は「WP Server Stats」または「Query Monitor」を推奨します。
- 投稿ページのみの限定動作で安全に導入できます。
5 まとめ
このサーバー負荷監視ウィジェットは、WordPress管理者がCPUとメモリの状態をリアルタイムで把握するのに最適です。
ダッシュボードやショートコード表示の両対応で、柔軟に運用可能です。